User Guide
The purpose of this document is to help you to use Cooka in web browser, including:
Manage dataset
Preview dataset
Insight dataset
Design experiment
Experiment list
We recommend Chrome v59 or above to visit Cooka.
Manage dataset
You can upload or import data from the server for training and the data file should meet the following conditions:
At least 2 columns
In CSV format
With headers or not
You can also choose the sampling strategy to analyze the dataset, supported sampling strategies:
by rows
by percentage
whole data
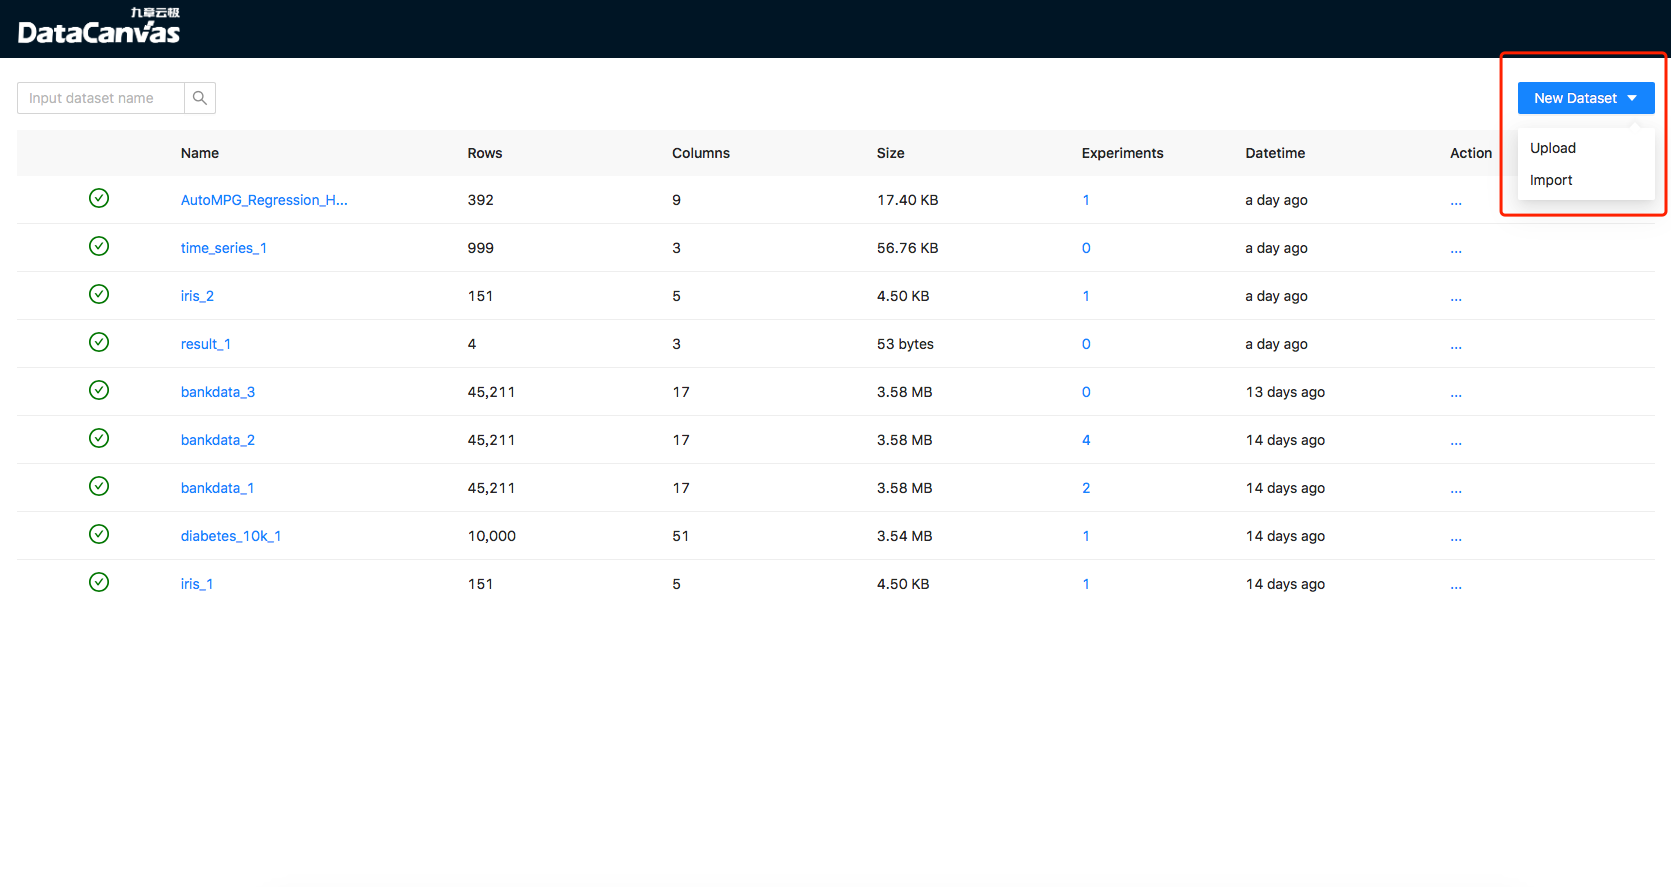
Datasets can be added in the dataset list page:
 image
image
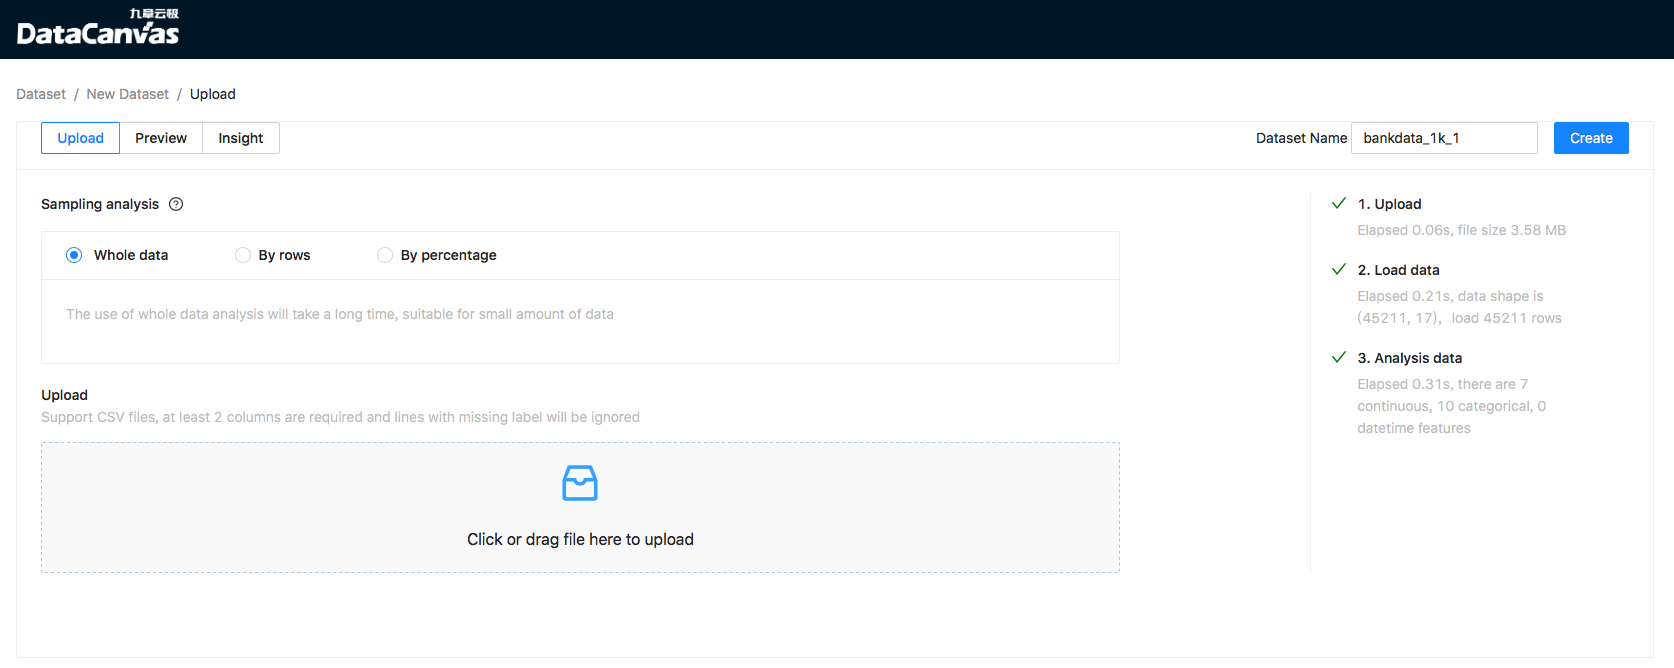
Upload
Users can upload files to Cooka through the browser to create datasets:
 image
image
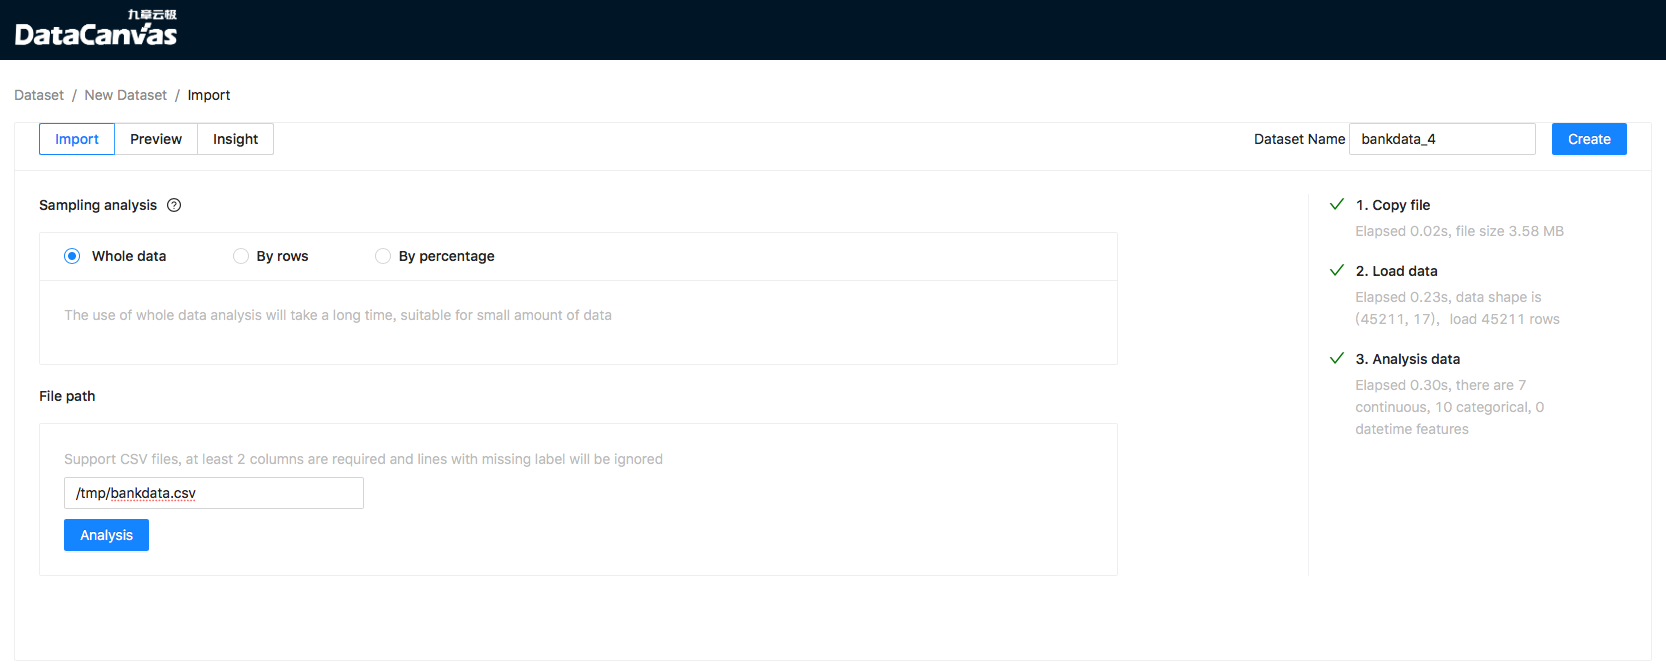
Import
Users can import files in server to Cooka. This way is friendly to large files, import process:
Input file path in server and wait it check passed
Click “Analyze” button, cooka will do analyze and the progress informantion should be displayed in the bar on the right
Check dataset name and click “Create” button to confirm
 image
image
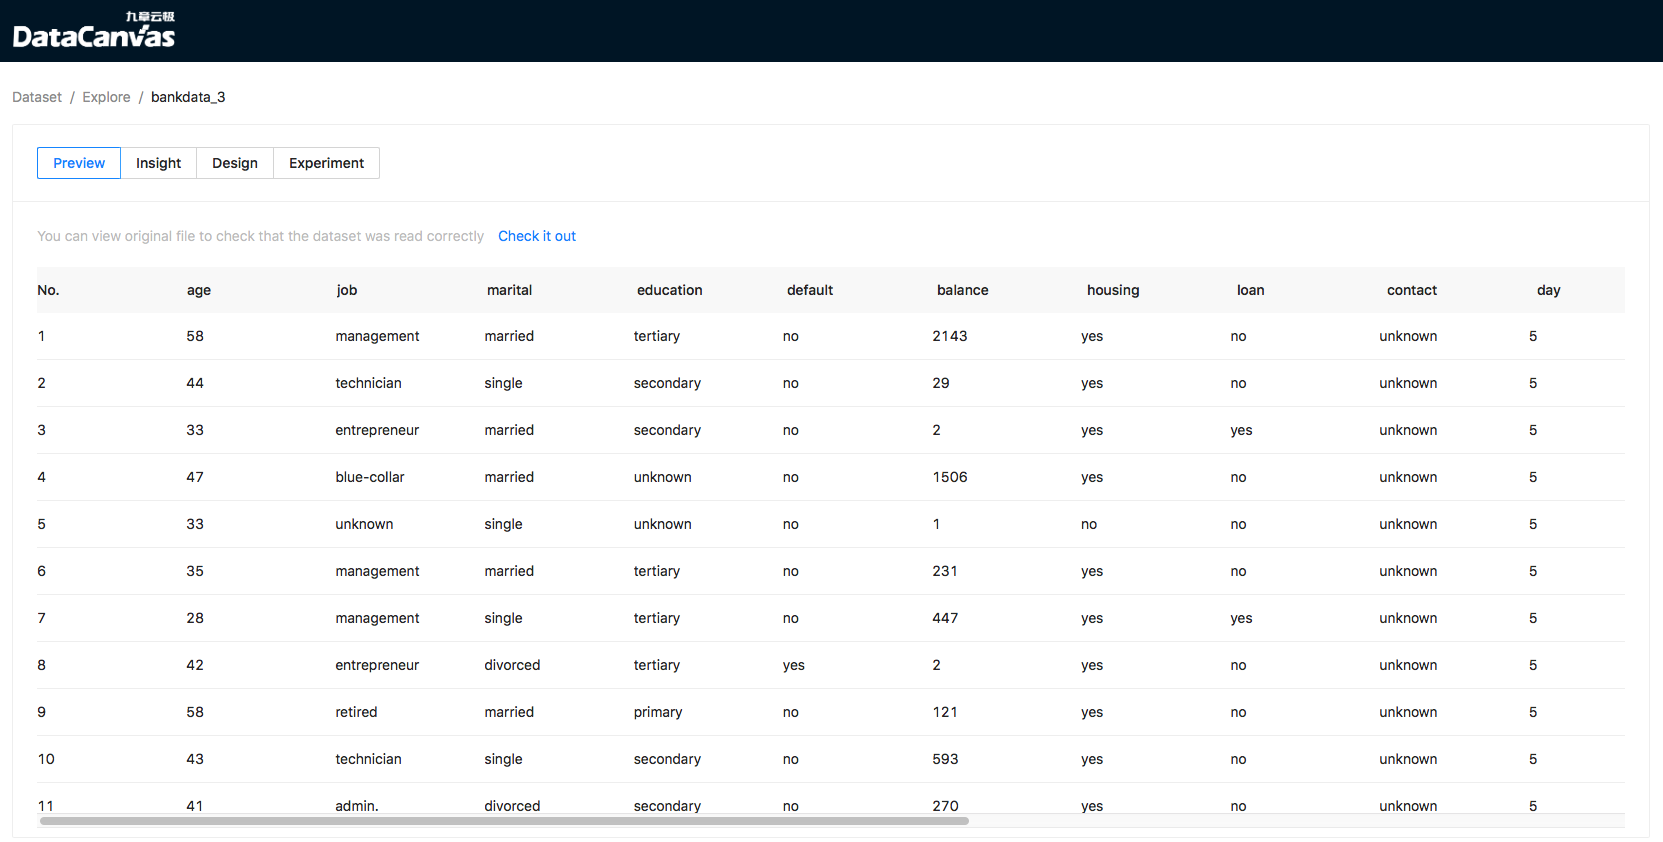
Preview dataset
You can view CSV file data in table view in “Preview” page:
 image
image
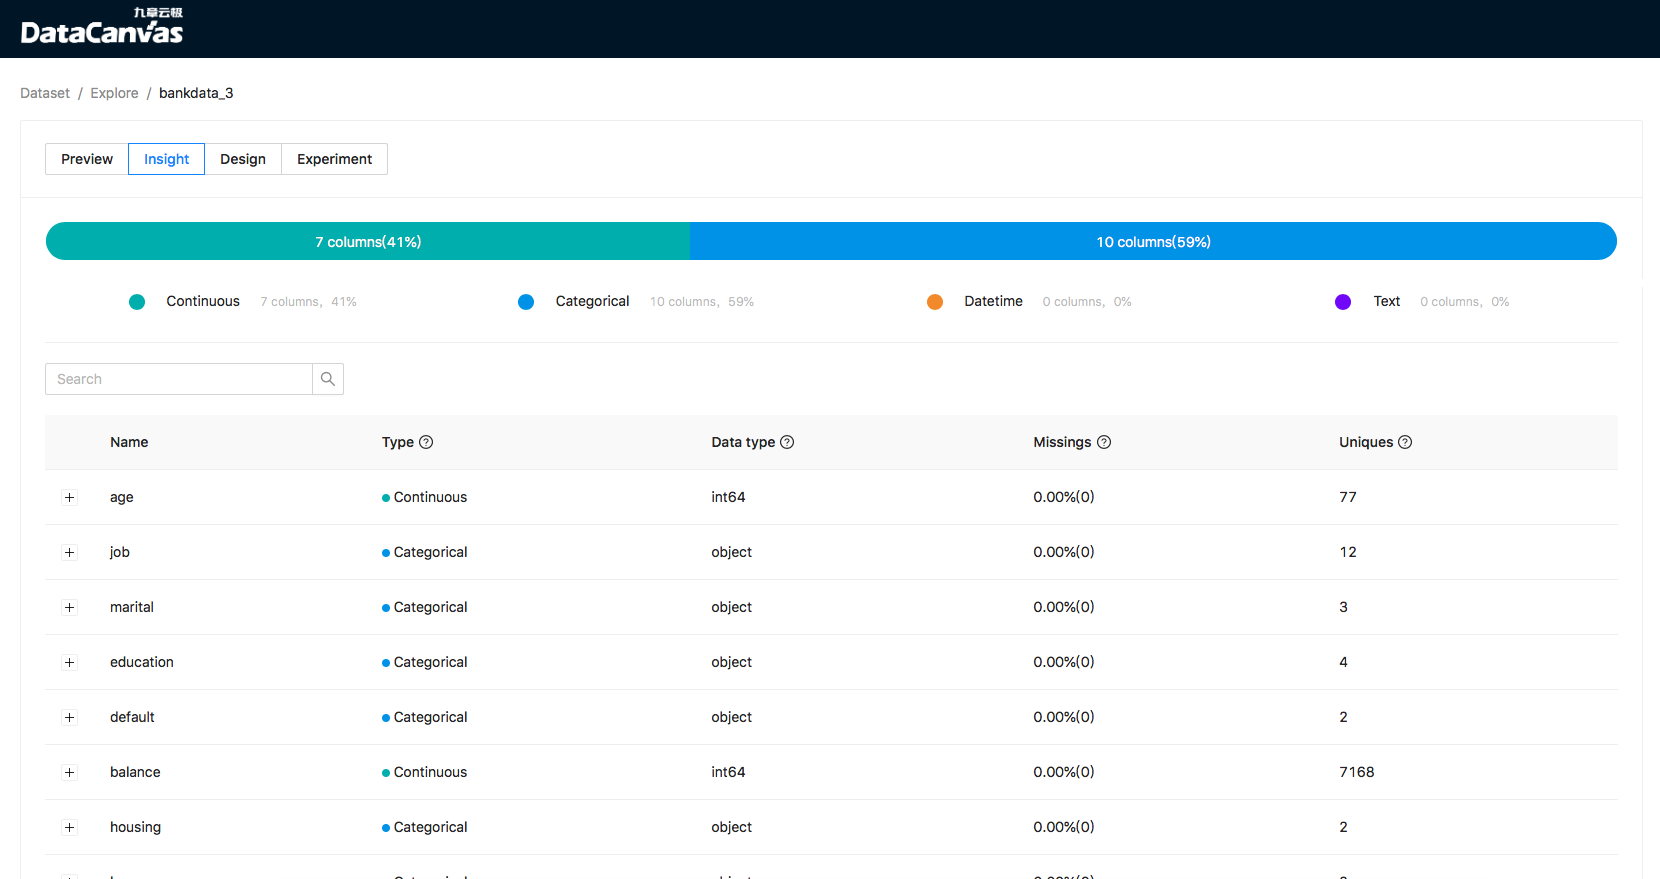
Insight dataset
Cooka will analyze the information of dataset, including:
distribution of different feature types
data type, feature type, unques, missing percentage, linear correlation of feature
 image
image
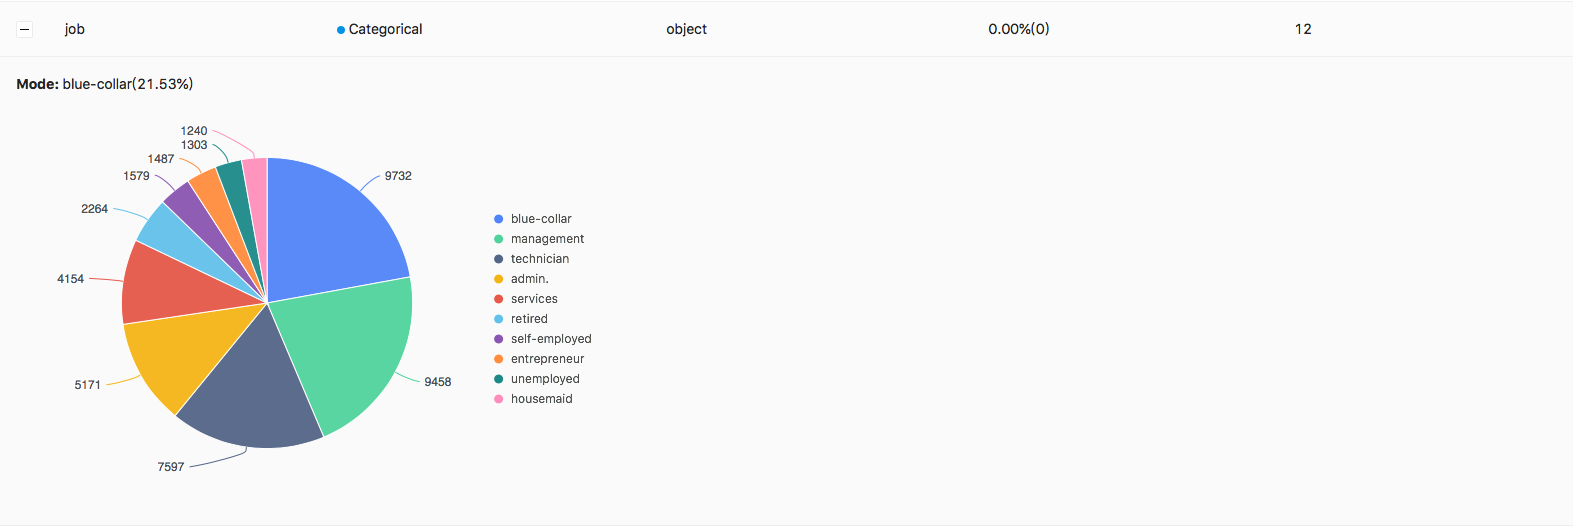
It will show mode and numerical distribution for categorical features:
 image
image
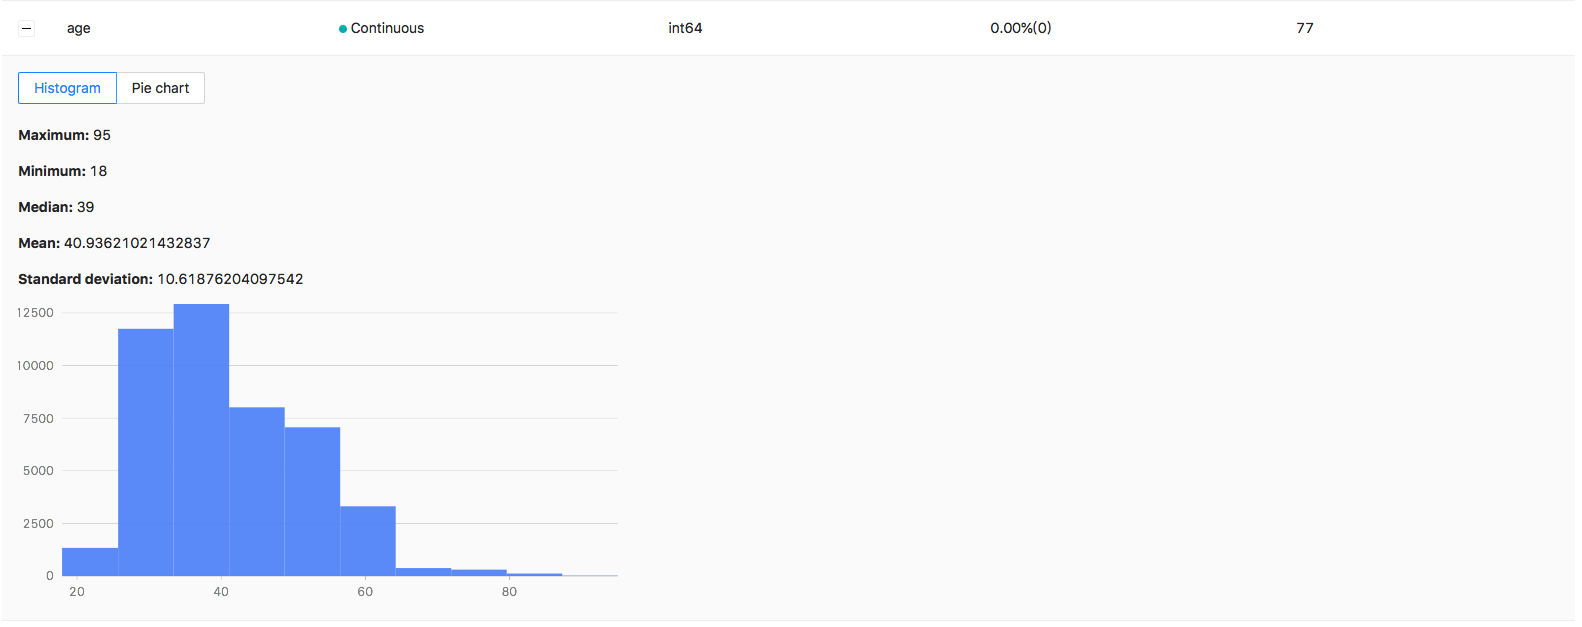
For continuous features, you can view the min/max/mean/median/standard deviation and the values distribution or interval distribution:
 image
image
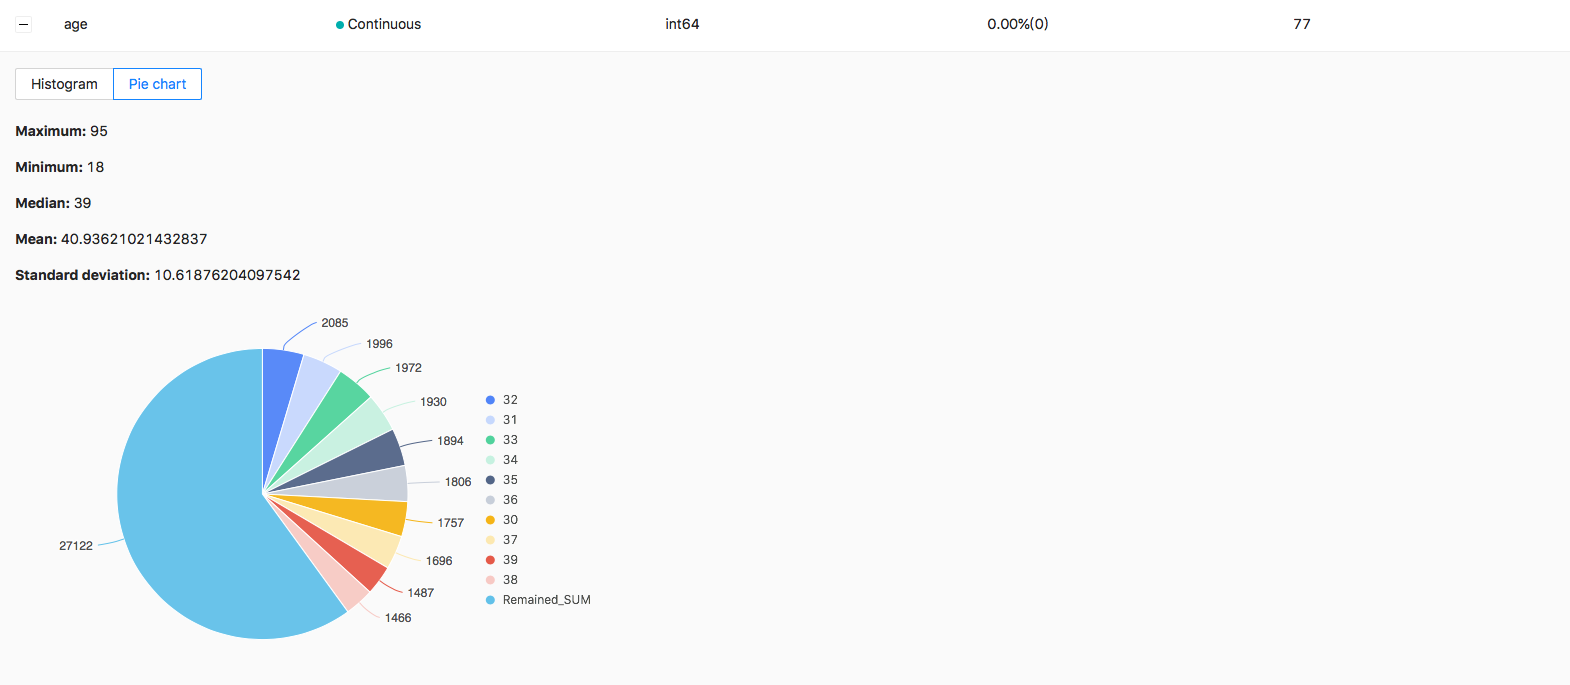
The values distribution:
 image
image
For datetime feature you can see statistics by year, month, day, hour, week:
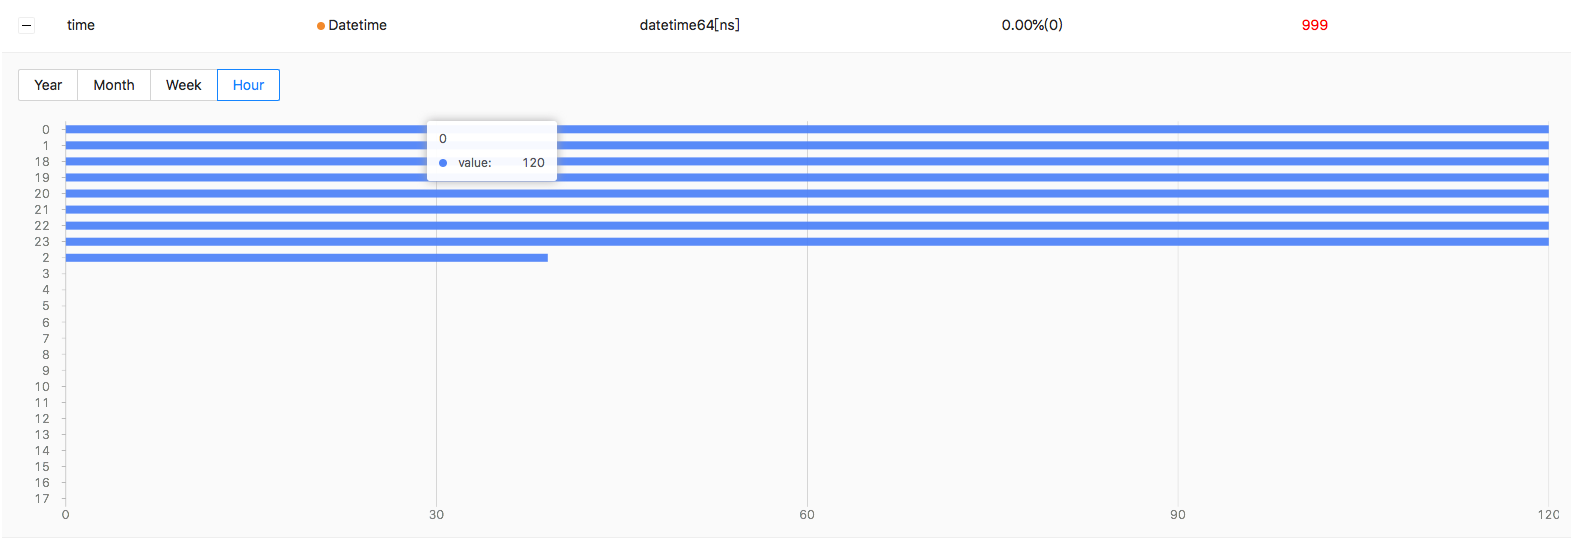 image
image
Cooka can note the poor quality feature and the reason, for example:
 image
image
The reason may be:
Correlation is too low
Missing percentage is too high
Constant feature
Id-ness feature(Every value is unique)
Design experiment
Users can design modeling experiments to define real-life problems as a modeling task. On the data exploration page, users can select one as target column:
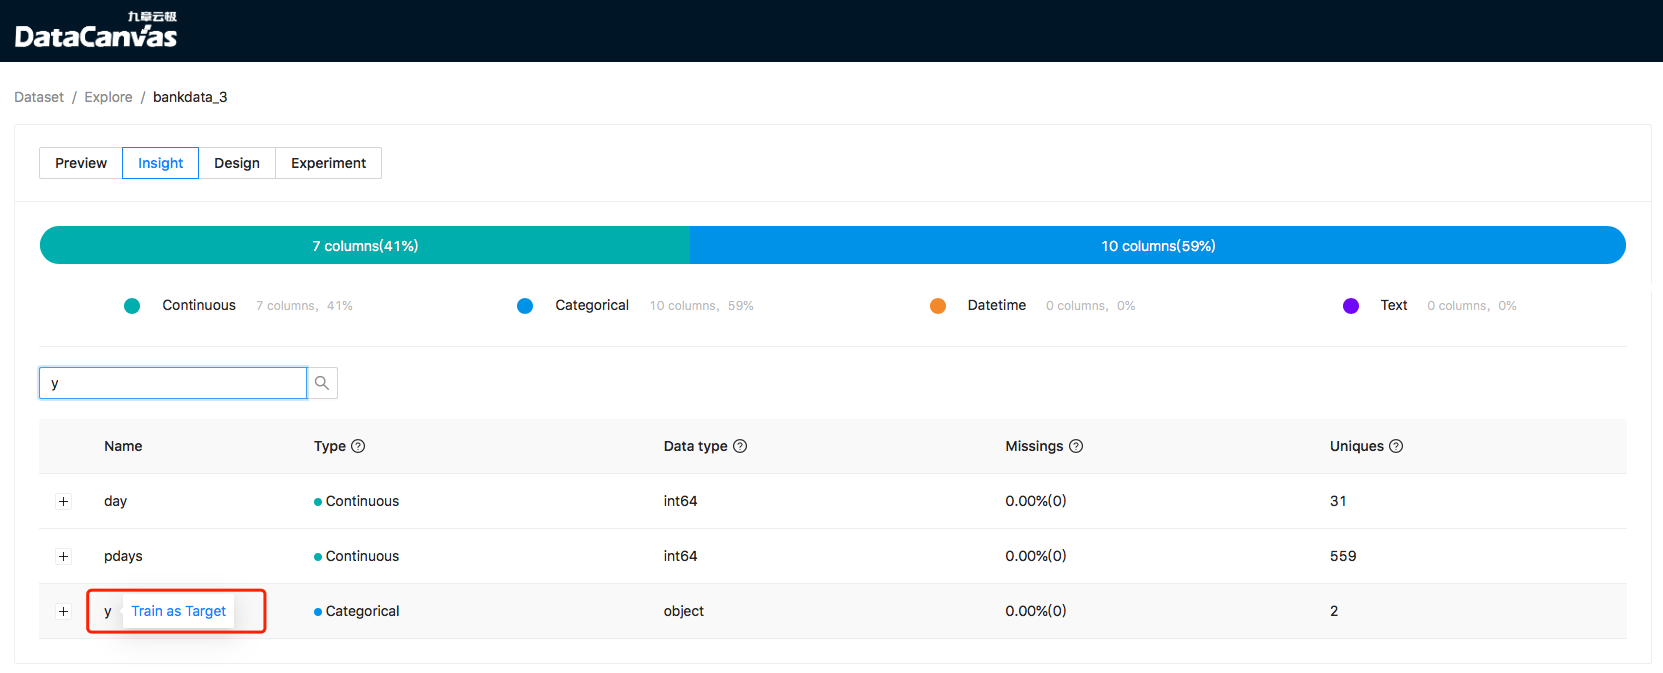 image
image
In the experiment design page, you can choose quick training mode or performance training mode. Quick mode uses general search space and less search times, while performance mode uses more comprehensive search space and more search times. Fast mode makes a balance between training time and model effect, while performance mode sacrifices time to improve model effect:
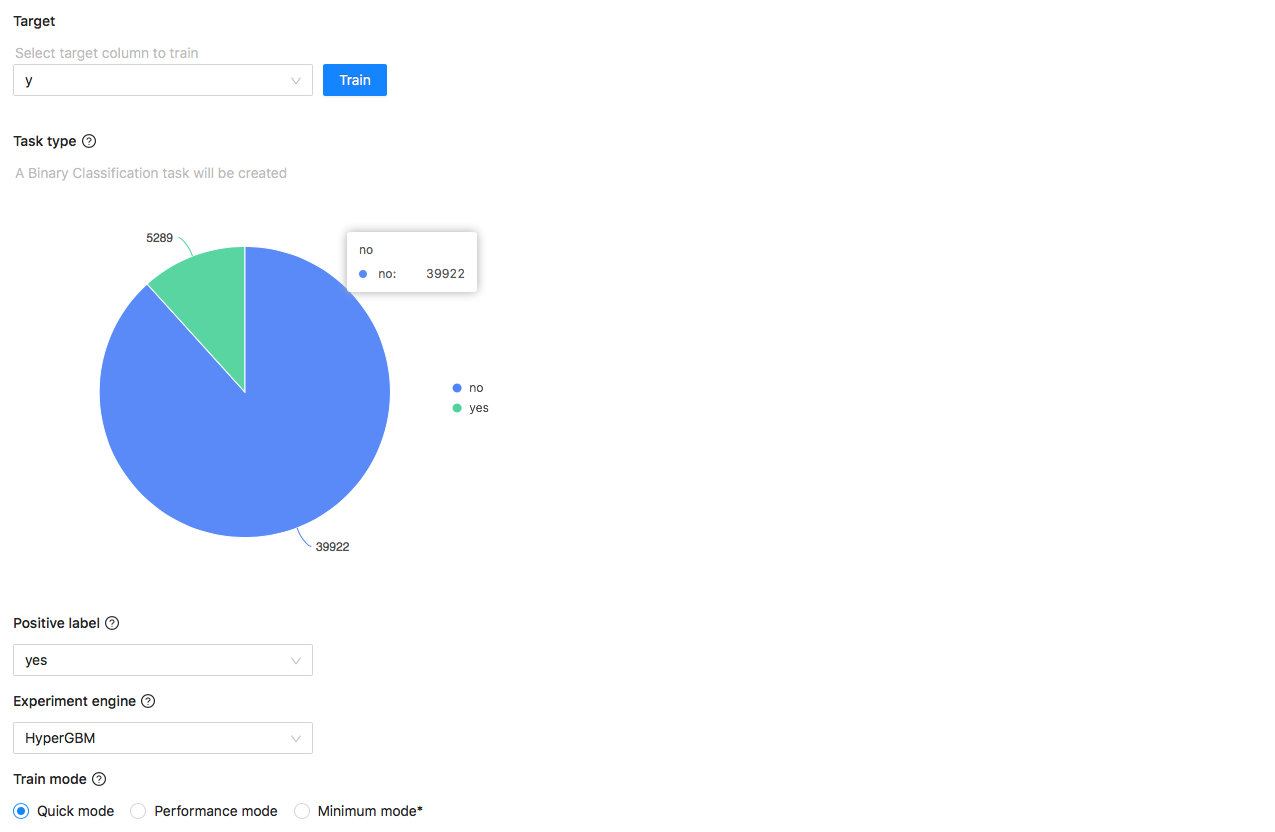 image
image
It will infer task type by the target column. There is 2 experiments engine HyperDT and HyperGBM, and they use neural network and GBM algorithms. If your data is in datatime order, you can select datetime series column, cooka will use the older data to train and the newer data to test model effect:
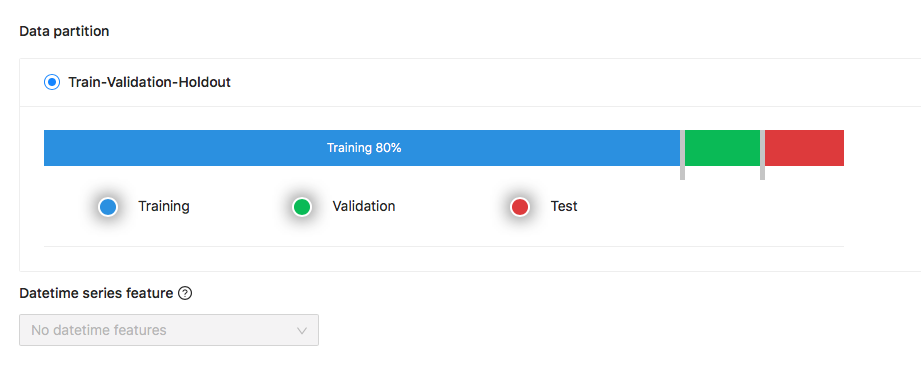 image
image
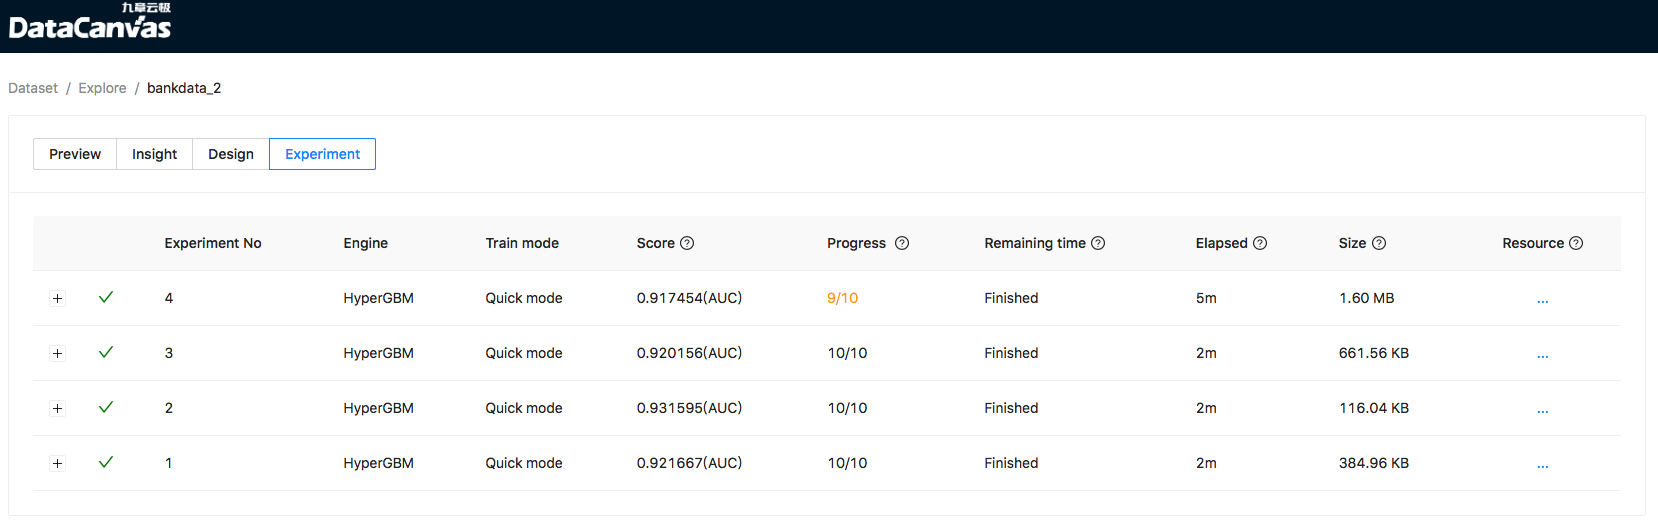
Experiment list
You can see the running status of the training task on the experiment list page, such as training progress and model score:
 image
image
Cooka supports early stopping, when the performance of the model can not be improved, it will terminate the training process in advance to save computing resources.
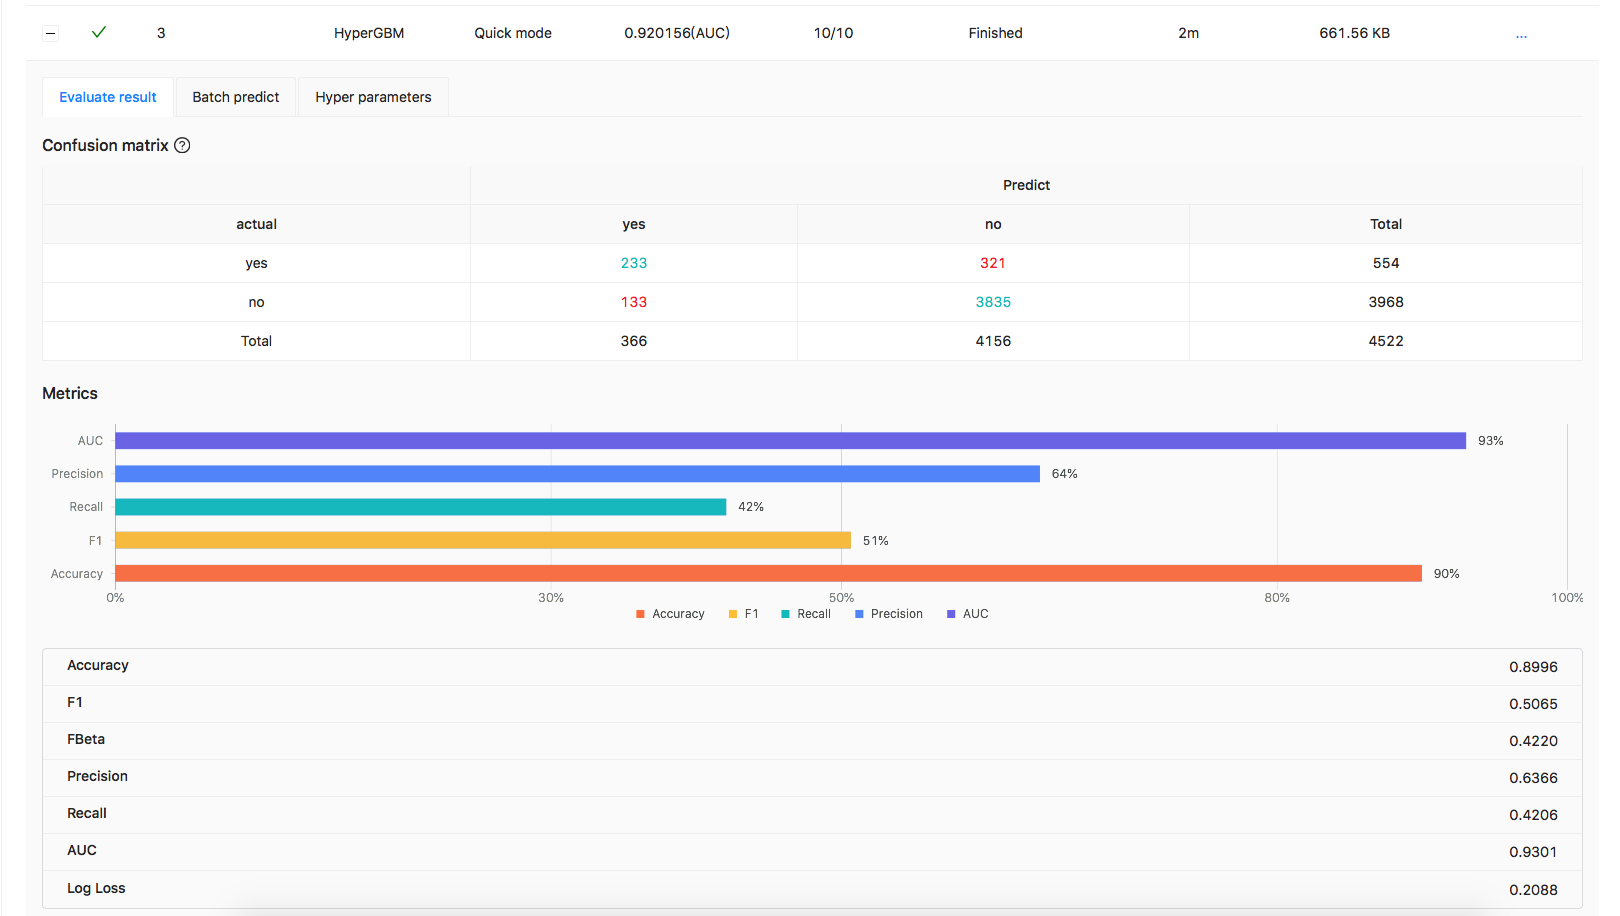
Model evaluation
For the completed experiments, you can see the evaluation of model including:
Confusion matrix and ROC curve for binary-classification
Evaluaion metrics
 image
image
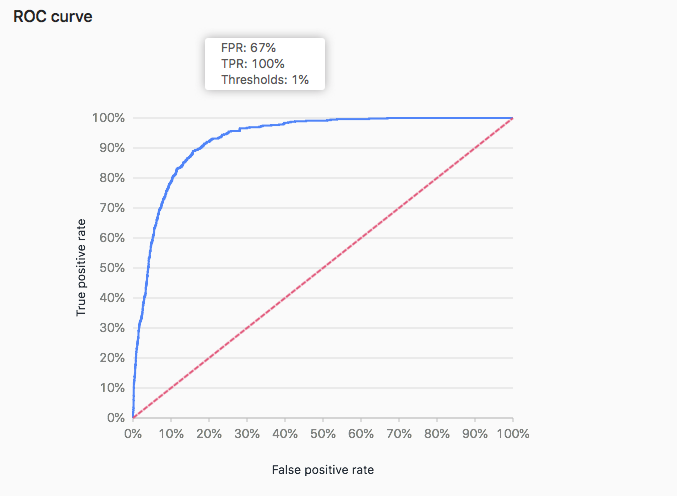
The ROC curve:
 image
image
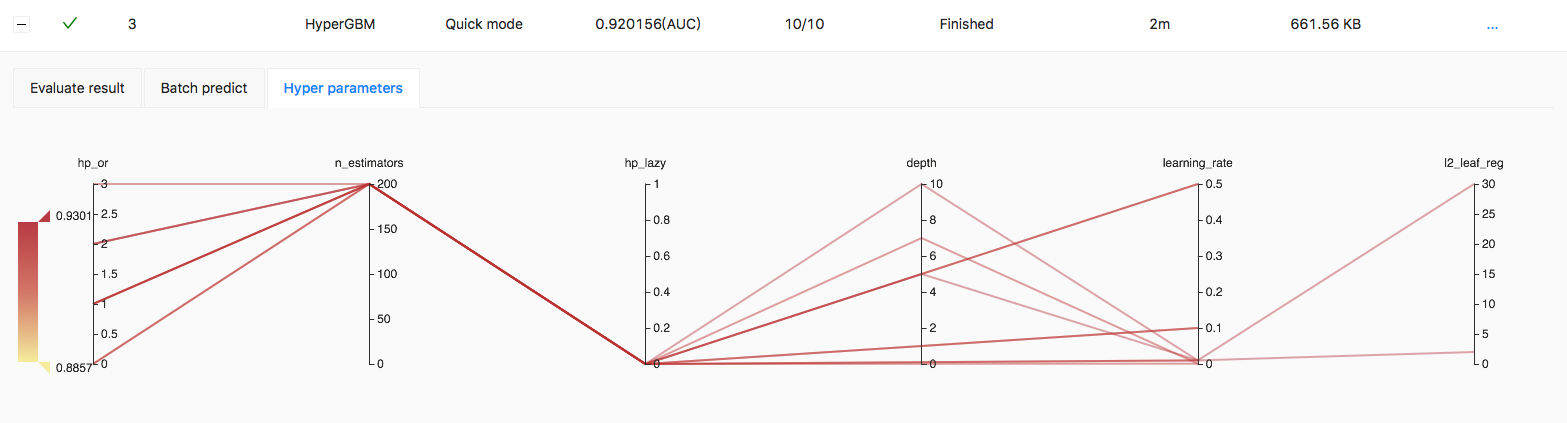
In the process of searching, Y-axes values represent the hyper parameters used in training, and the color of lines represents the score of the model, the darker the color, the higher the score:
 image
image
Model predict
The model will be saved in the training end, Users can upload test data to use the model, and the prediction progress will be displayed on the page:
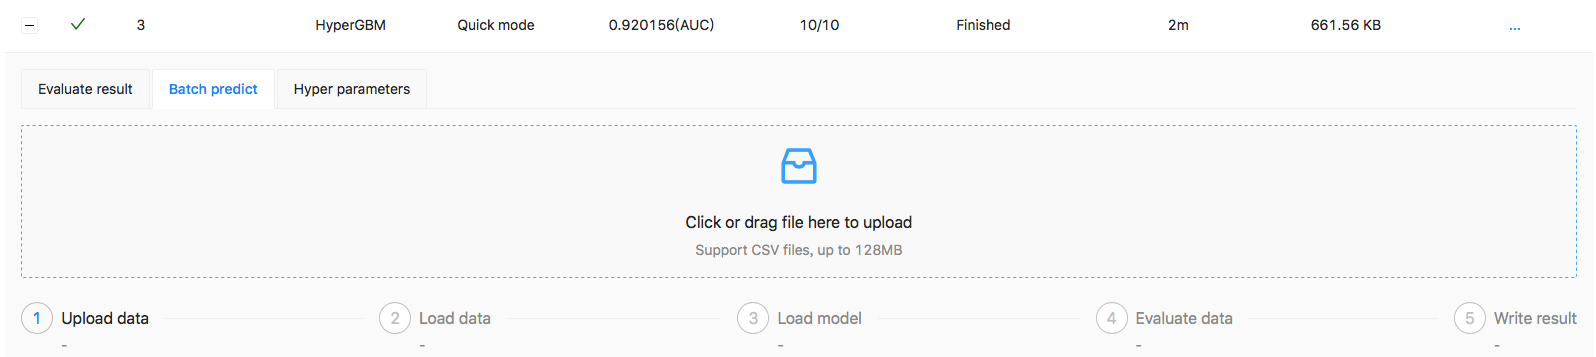 image
image
The results can be downloaded when prediction finished.
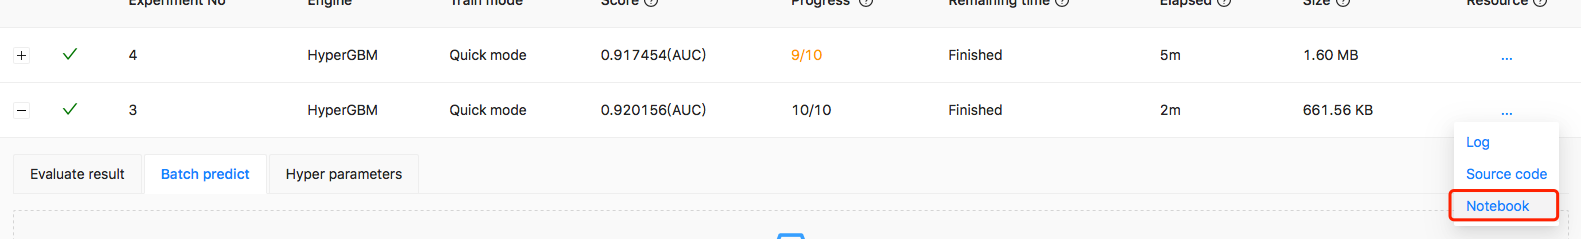
Export to notebook
You can export experiment to notebook to custom modeling:
 image
image
An example of Notebook:
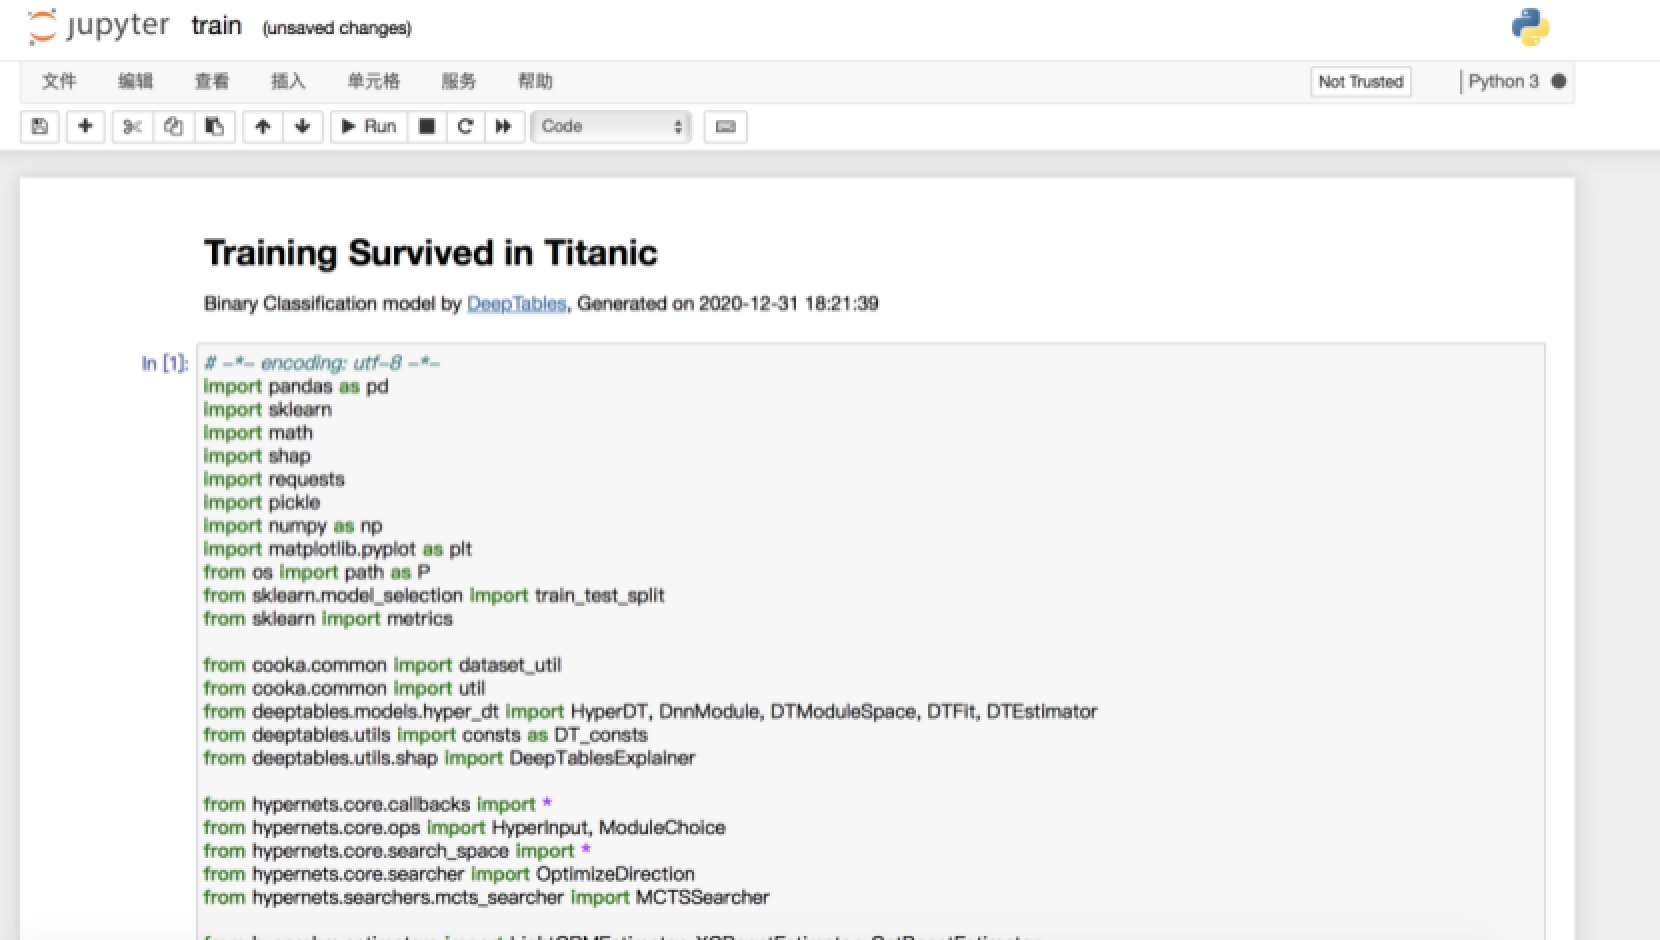 img
img
Notebook also contains explanation of prediction:
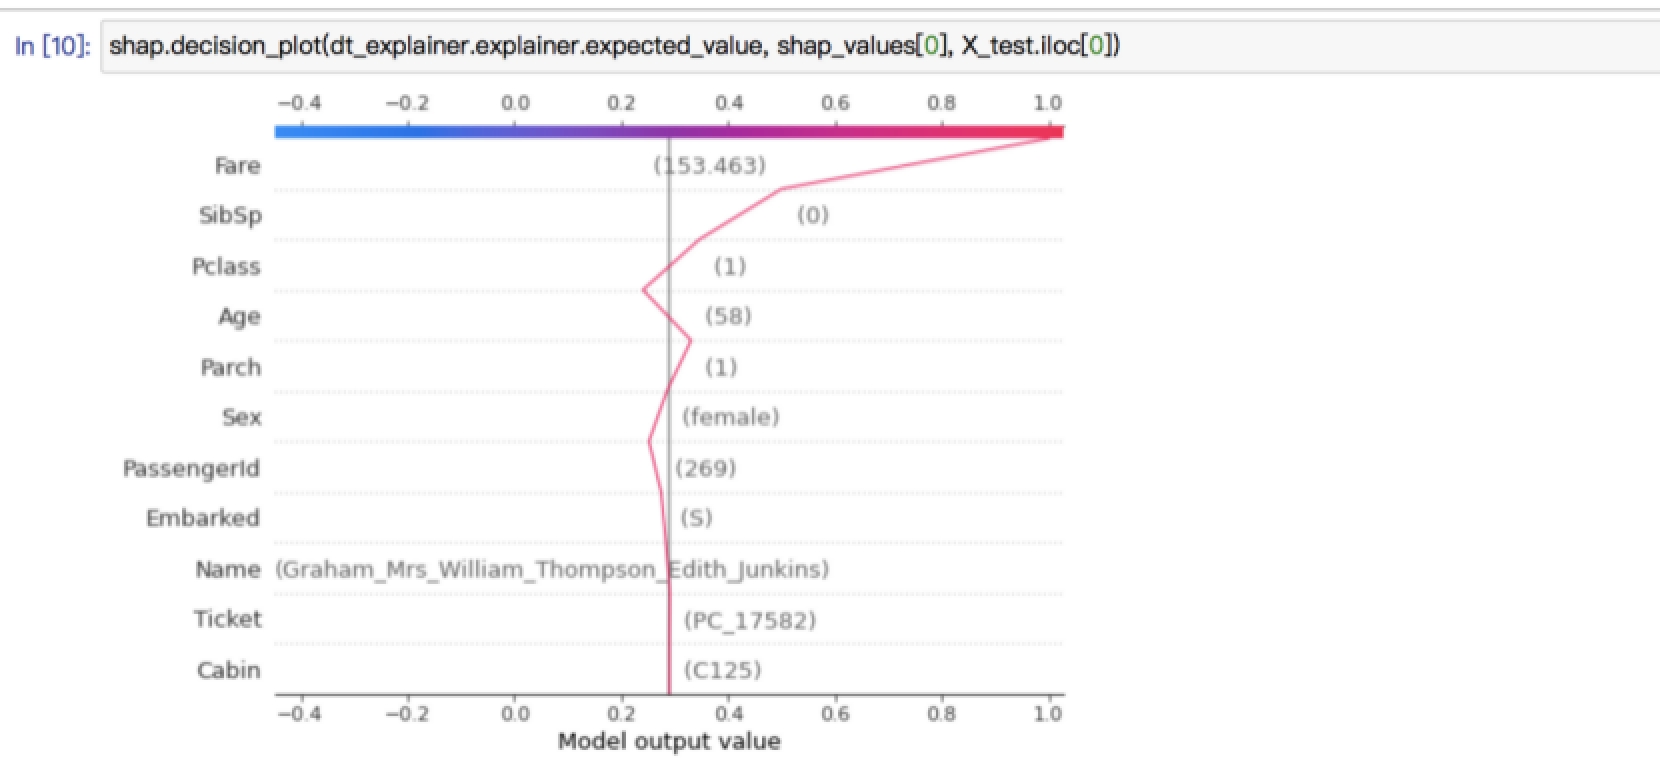 img
img
And feature importance:
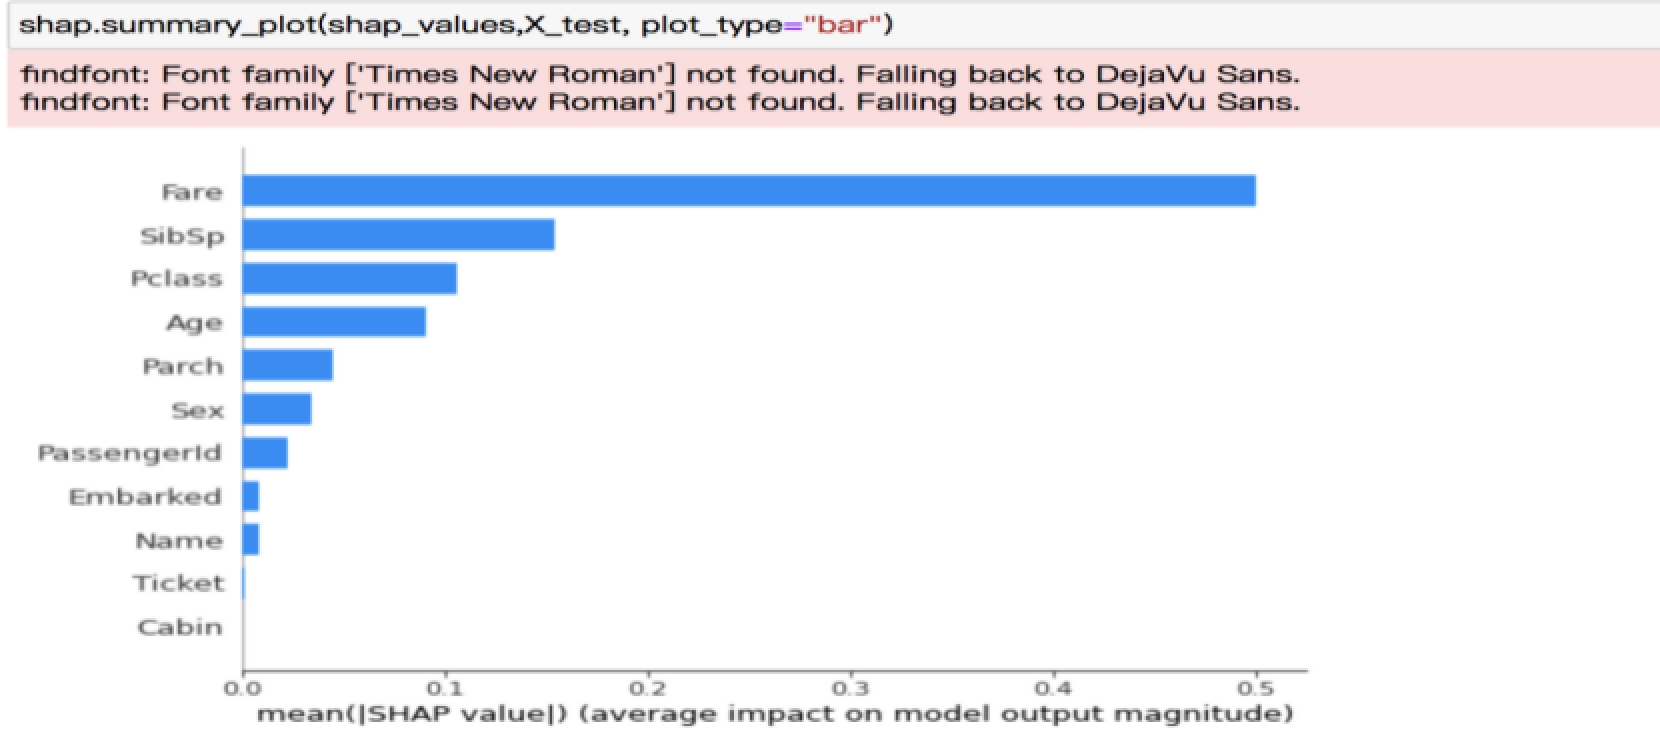 img
img
If it is a binary classification task, the ROC curve and confusion matrix of the model will also be included.